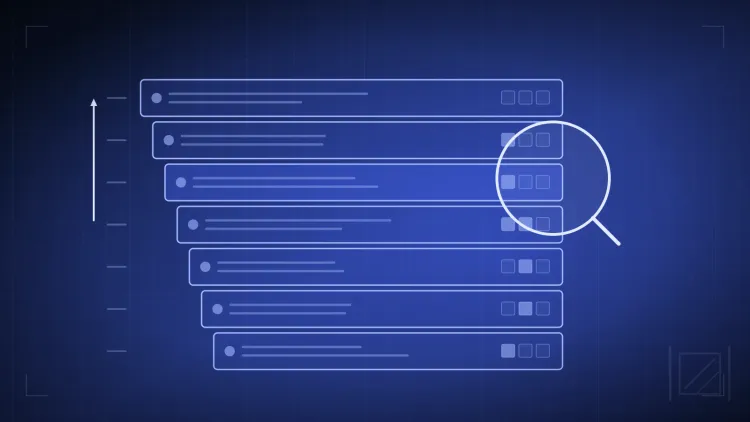
Generating Thread Dumps
Thread dumps are the basic diagnostic tool for JVMs. Thread dumps present a partial state of each Java thread in a running JVM. I say partial because it doesn’t present all information that captures the state of a Java thread. The state of a running Java thread is stored in a series of data…
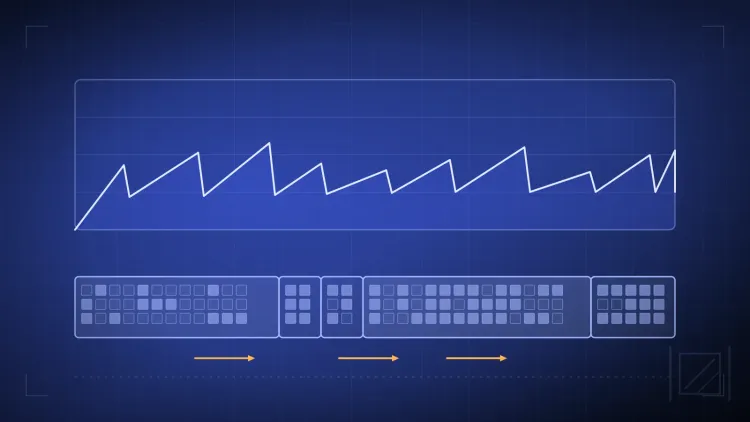
My JVM ran out of memory! What objects are consuming all of the memory?
This article isn't a comprehensive JVM Java heap sizing and garbage collection tuning document; its goal is simply to outline options for identifying which type of Object(s) are consuming the majority of memory in a running JVM--troubleshooting memory leaks in the Java heap. As usual, I focus on…
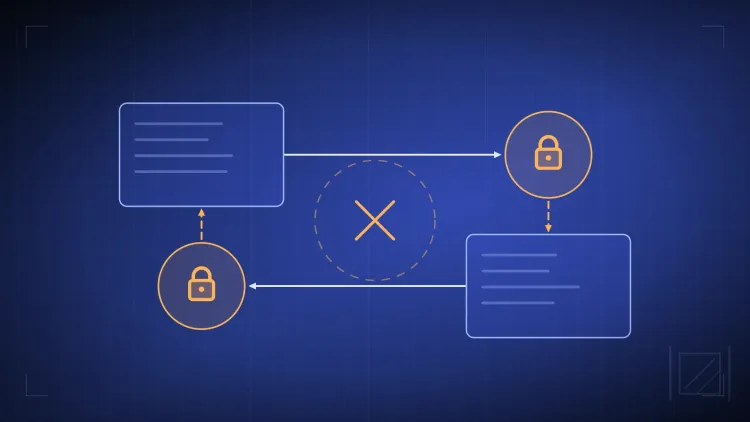
Troubleshooting Deadlock Conditions With Monitor Locks In Java Virtual Machines
In this article, I wanted to present a brief tutorial regarding troubleshooting deadlock conditions in JVMs. Before one can troubleshoot a deadlock condition, one needs to understand what it is; to this end, I have written a simple Java program called DeadLock.java, which is guaranteed to very…
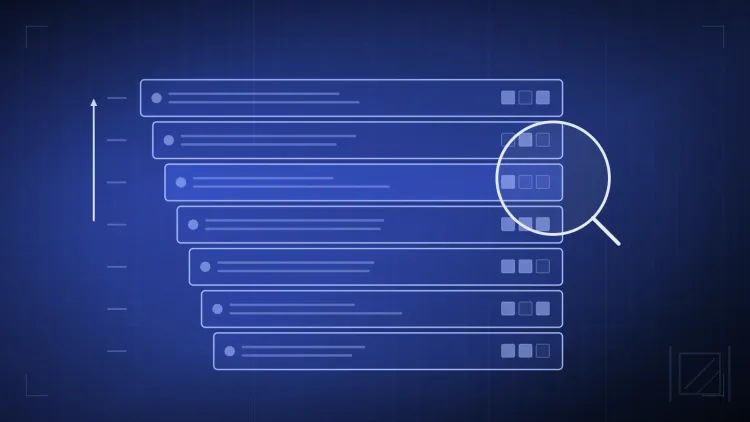
Generating Thread Dumps from a Sun or IBM JVM Running As A Windows Service
I was recently asked if there was a way to generate a Thread Dump from a JVM running as a Windows Service. It occured to me that I had a similar issue during my Masters Project when I was trying to generate a thread dump from a Cygwin xterm; Googling at the time turned up no good way of accomplishing the task. But, I knew that you could use the Java Debugger that ships with the Sun JDK, jdb, to generate a thread dump of all non-System Threads in a JVM. I posed this as a solution to generating Thread Dumps from a JVM running as a Windows Service.